Data Set 1:
You can view the live version of this chart here. This is a graphic representation of reasons children give for bullying.
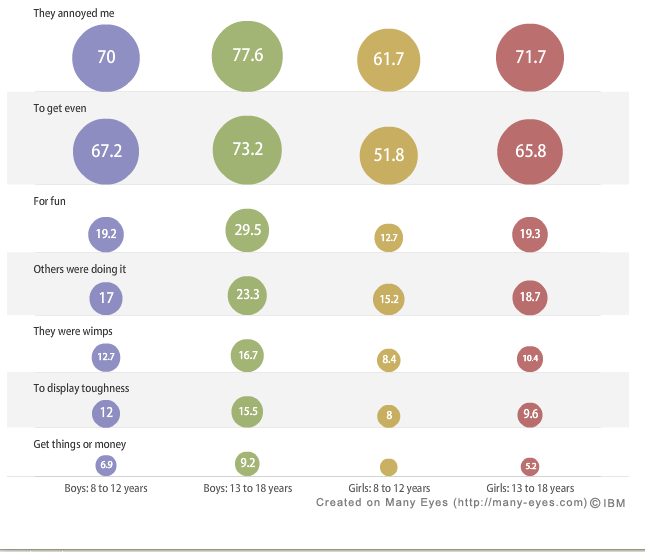
Chart Representation:
This is a visual representation of a study done by Ken Rigby, an associate professor of social psychology at the University of South Australia (1997).
Data Explanation:
The matrix chart lists percentages for Boys and Girls ages 8 to 12 and 13 to 18 years. Each row provides reasons children listed for bullying during the 1997 study. Each column is color-coded and increases vertically for the smallest to largest percentages for reasons children bullied, with "They annoyed me," as the most common factor for bullying and to "Get things or money," as the least common reason for bullying overall.
Data Set 2:
This chart shows which students were the most victimized by bullies, as well as the type of tactics the bullies used.
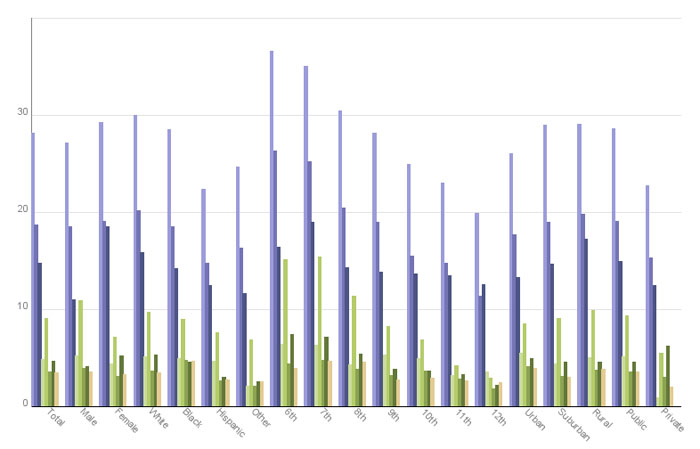
Graph Representation:
This graph is a visualization of a study conducted by the U.S. Department of Justice (2005).
Data Explanation:
The data is categorized according to the victim's sex, grade level and type of school he or she attended. The bars are color-coded to show how the victim was bullied, ranging from taunts to physical violence. According to the data, females were slightly more bullied than males in total, white children were the ethnicity most prone to bullying, and rural schools had slightly more bullying than rural and suburban schools.
Data Set 3:
You can view the live version of this chart here. This chart shows the number of girls who considered skipping school because of bullying-related pressures.

Chart Representation:
The data used in the chart represent the findings Dr. Ken Rigby regarding trends in bullying, and other forms of peer victimization. These findings were originally published in Children Australia in 1997.
Data Explanation:
The data here are organized are organized according to two age groups of girls; girls 8-12 years old and girls 13-18 years old. The bars represent the number of girls who have never considered skipping school because of bullying, as well as those who have thought about it, those who have skipped once or twice and those who have skipped school more often for the same reasons. By clicking the legend on the left-hand side of the chart, you can toggle between the sample age groups.
---
 Uploading ....