| | | |
 Uploading .... Uploading ....
You can view the live version of this chart here.
The data in the chart above come from the Pew Research Center for the People & the Press.
What this chart represents
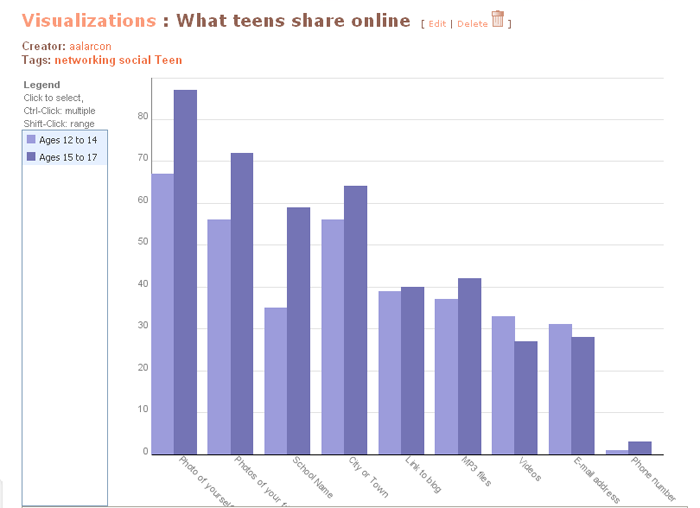
This chart depicts the different methods teens use to represent themselves online, as found in the study. Older users are more likely to use video and other multimedia. They are also less likely to disclose their phone numbers, which suggests they are both more savvy with online media and also aware of the dangers of posting too much personal information online.
The data were gathered through telephone interviews conducted by Princeton Survey Research Associates between Oct. 23 and Nov. 19, 2006 among a sample of 935 teenagers, ages 12-17, and their parents or guardians.
About the data visualization
This visualization is organized as a bar chart. It shows the relative frequency of the types of content teens are adding to their social networking profiles. The teens surveyed are divided into two groups, ages 12-14 and ages 15-17, to allow for comparisons.
The data used for this graph can be found in this study.
---
|
|
|
| | | |
|